it is clear that if excitation is varied from very low (under excitation) to very high (over excitation) value, then current Ia decreases, becomes minimum at unity p.f. and then again increases. But initial lagging current becomes unity and then becomes leading in nature. This can be shown as in the Fig. 1.
 |
| Fig. 1 |
Excitation can be increased by increasing the field current passing through the field winding of synchronous motor. If graph of armature current drawn by the motor (Ia) against field current (If) is plotted, then its shape looks like an english alphabet V. If such graphs are obtained at various load conditions we get family of curves, all looking like V. Such curves are called V-curves of synchronous motor. These are shown in the Fig. 2a).
As against this, if the power factor (cos Φ) is plotted against field current (If), then the shape of the graph looks like an inverted V. Such curves obtained by plotting p.f. against If, at various load conditions are called Inverted V-curves of synchronous motor. These curves are shown in the Fig. 2(b).
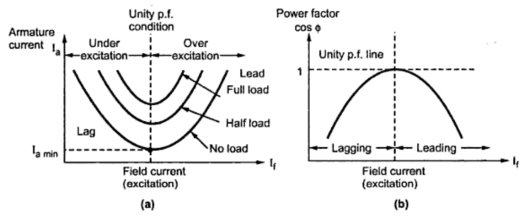 |
| Fig. 2 V-curves and Inverted V-curves |
1.1 Experimental Setup to Obtain V-Curves
Fig. 3 shows an experimental setup to obtain V-curves and Inverted V-curves of synchronous motor.
Stator is connected top three phase supply through wattmeters and ammeter. The two wattmeter method is used to measure input power of motor. The ammeter is reading line current which is same as armature (stator) current. Voltmeter is reading line voltage.
 |
| Fig. 3 Experimental setup for V-curves |
A rheostat in a potential divider arrangement is used in the field circuit. By controlling the voltage by rheostat, the field current can be changed. Hence motor can be subjected to variable excitation condition to note down the readings.
Observation Table :

Now IL = Ia, per phase value can be determined, from the stator winding connections.
IL = Iaph for stator connection
IL/√3 = Iaph for delta connection
The power factor can be obtained as

The result table can be prepared as :

The graph can be plotted from this result table.
1) Ia Vs If → V-curve
2) cosΦ Vs If → Inverted V-curve
The entire procedure can be repeated for various load conditions to obtain family of V-curves and Inverted V-curves.
No comments:
Post a Comment